
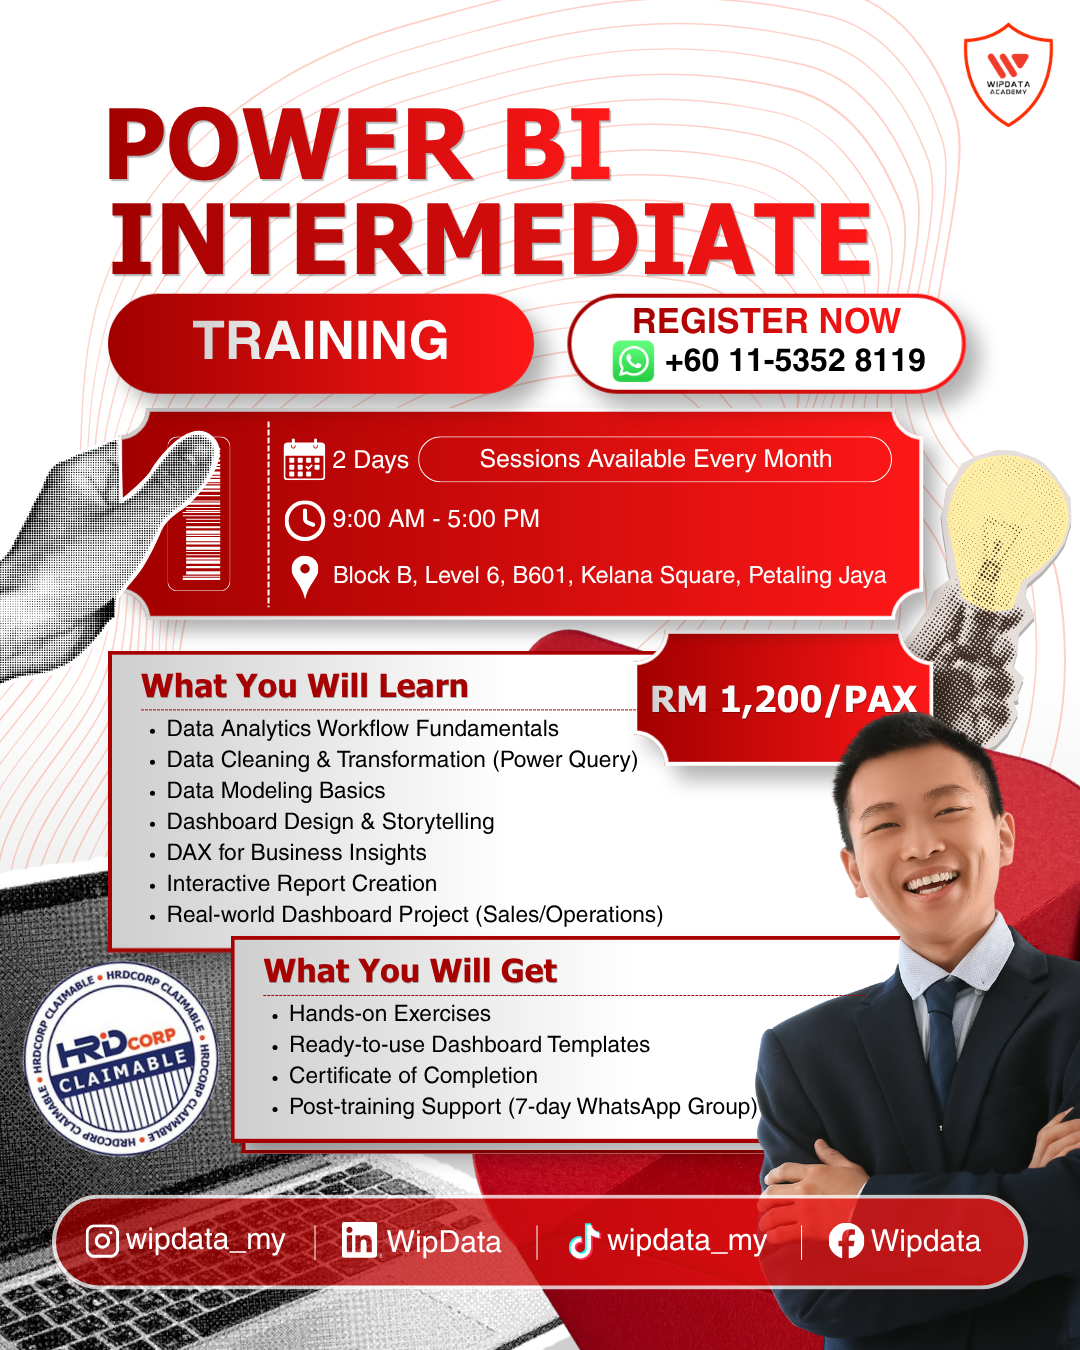
Power BI Intermediate
RM1,200.00
Description
Duration: 2 days
Course Overview:
Data is one of the most valuable assets any organisation holds, but raw data sitting in spreadsheets, databases, and disconnected systems delivers no value on its own. Power BI, Microsoft's industry-leading business intelligence platform, transforms raw data into dynamic, interactive dashboards and reports that enable teams to make faster, more confident, and better-informed decisions. Used by over 250,000 organisations globally, Power BI has become the standard tool for data analysts, finance teams, operations managers, HR professionals, and business leaders who need to see what their data is actually telling them clearly, quickly, and at any level of detail.
This two-day, hands-on programme covers the complete Power BI analytics workflow across seven structured modules. Module 1 establishes the data analytics fundamentals and Power BI ecosystem. Module 2 covers Power Query for data cleaning and transformation. Module 3 builds the data model using star schema principles and table relationships. Module 4 develops DAX skills for business measures, including time intelligence, CALCULATE, and RANKX. Module 5 covers dashboard design principles and data storytelling. Module 6 covers interactive report features including drill-through, bookmarks, and field parameters. The programme culminates in Module 7, a real-world sales or operations dashboard capstone project that applies every skill from the two days into one polished, functional deliverable.
By the end of this programme, participants will be empowered to independently build, format, and publish professional Power BI dashboards, from connecting and cleaning raw data to building a clean data model, writing DAX measures for key business KPIs, designing a user-friendly interactive report, and sharing it via Power BI Service. Whether you are building your first Power BI report or looking to formalise and deepen an existing skill set, this programme gives you the complete foundation to deliver data insights that are meaningful, visual, and immediately actionable in your organisation.
Audience:
Data analysts, finance professionals, operations managers, HR executives, sales analysts, reporting specialists, and any working professional who works with data and wants to transform reports and dashboards using Microsoft Power BI. Suitable for beginners to Power BI who have a basic understanding of data concepts and spreadsheet tools.
Prerequisite:
Basic familiarity with Microsoft Excel understanding of tables, formulas, and basic data concepts. No prior Power BI experience required. Participants must have Microsoft Power BI Desktop installed on their laptop (free download from Microsoft) prior to attending. A Microsoft account is required to access Power BI Service features.
Methodology:
The programme will maximise understanding and learning through Interactive Lectures, Live Tool Demonstrations, Hands-on Workshops, Guided Exercises using Real-World Datasets, Peer Review, and a full capstone dashboard project.
What you will get:
- Ready-to-use Power BI Dashboard Templates
- Step-by-step DAX Measures Reference Sheet
- Certificate of Completion
- Power BI Best Practices Cheat Sheet
- Hands-on Exercises with Real-World Datasets
- Access to Sample Dataset Used in Training
- 7-Day Post-Training WhatsApp Support Group
- Wipdata Academy Learning Pathway Guide
Objective:
- Apply the end-to-end Power BI analytics workflow connecting to data sources, cleaning and transforming data with Power Query, and loading it into a structured, relationship-based data model.
- Build a star schema data model with correctly configured table relationships and write core DAX measures for business KPIs, including time intelligence, CALCULATE-based filters, and dynamic ranking.
- Design and build professional, visually compelling Power BI dashboards that apply data storytelling principles, appropriate chart selection, and brand-consistent formatting for management and stakeholder audiences.
- Create fully interactive Power BI reports using slicers, drill-through, bookmarks, field parameters, and cross-filtering and publish and share reports via Power BI Service.
Course Module:
Module 1: Data Analytics Workflow Fundamentals
- What is data analytics the four types: descriptive, diagnostic, predictive, prescriptive
- The end-to-end analytics workflow: Connect, Clean, Model, Analyse, Visualise, Share
- Power BI ecosystem: Desktop, Service, Mobile App, Gateway, Embedded
- Power BI Desktop interface: Report View, Data View, Model View orientation
- Connecting to data sources: Excel, CSV, SQL Server, SharePoint, Web
- Overview of the full Power BI workflow: Query Editor to Report Canvas
- Power BI licensing: Free, Pro, and Premium what each enables
- Power BI vs. Excel: when to use which, and when to use both
Module 2: Data Cleaning & Transformation (Power Query)
- What is Power Query and why it is the foundation of reliable analytics
- Power Query Editor interface: ribbon, query pane, Applied Steps, preview
- Connecting to multiple data sources within one report
- Data profiling: column quality, column distribution, column profile
- Promoting headers, changing data types, and correcting null values
- Removing duplicates, filtering rows, and removing unnecessary columns
- Splitting and merging columns for clean, analysis-ready fields
- Replacing values, trimming text, and standardising inconsistent entries
- Grouping and aggregating summary data without leaving Power Query
- Appending queries: stacking tables from multiple files or sheets
- Merging queries: combining tables on a common key (the VLOOKUP equivalent)
- Applied Steps and the M language: understanding the transformation log
Module 3: Data Modeling Basics
- What is a data model and why it matters for accurate analytics
- Fact tables vs. dimension tables: the conceptual foundation
- Building a star schema in Power BI's Model View
- Creating relationships: one-to-many, one-to-one, many-to-many
- Cardinality and cross-filter direction: choosing the right setting
- Active vs. inactive relationships: when and how to use both
- Why you need a dedicated Date Table and how to create one in Power BI
- Hiding columns that should not be used in reports
- Data model best practices: naming conventions, clean structure, and performance
- Common data modelling mistakes and how to avoid them
Module 4: DAX for Business Insights
- What is DAX and why it is Power BI's analytical engine
- Calculated columns vs. measures: the critical difference and when to use each
- Implicit vs. explicit measures: why explicit is always better practice
- Basic DAX measures: SUM, COUNT, COUNTROWS, AVERAGE, MIN, MAX
- DIVIDE: a safe division that handles divide-by-zero errors gracefully
- CALCULATE the most powerful DAX function, explained step by step
- Filter context and row context: the two contexts every DAX writer must understand
- IF and SWITCH for conditional business logic in measures
- Time intelligence: TOTALYTD, TOTALMTD, SAMEPERIODLASTYEAR, DATEADD
- RANKX ranking products, regions, or customers dynamically
- VAR and RETURN using variables for cleaner, faster DAX
- Creating a dedicated Measures Table for a clean, organised data model
Module 5: Dashboard Design & Storytelling
- What separates a great dashboard from a confusing one
- The 3 questions every dashboard must answer: Who is it for? What decision does it support? What action should it drive?
- Dashboard design principles: hierarchy, alignment, white space, and simplicity
- Choosing the right visual for the right message: bar, line, card, matrix, scatter, map, gauge, donut
- When NOT to use a chart when a table or card communicates better
- Colour theory for dashboards: using colour purposefully, not decoratively
- Typography in Power BI: font choices, sizing, and label clarity
- Page layout and grid alignment making a report feel professional
- Data storytelling: structuring a report to guide the reader from summary to detail
- Applying and customising Power BI themes
- Tooltip pages: adding contextual detail without cluttering the report
Module 6: Interactive Report Creation
- Slicers: types (list, dropdown, between, relative date), formatting, and sync across pages
- Cross-filtering and cross-highlighting controlling how visuals interact
- Edit interactions: customising which visuals filter which
- Drill-through pages: creating a detail page accessible from a summary visual
- Drill-down within visuals: hierarchy navigation in bar and line charts
- Bookmarks: saving report states for storytelling and navigation
- Buttons: creating next/back navigation and bookmark triggers
- Field parameters: letting report viewers switch metrics or dimensions dynamically
- What-if parameters: building scenario sliders for sensitivity analysis
- Publishing to Power BI Service: sharing and workspace setup
- Row-Level Security (RLS): restricting data access by user role



Reviews
There are no reviews yet.