
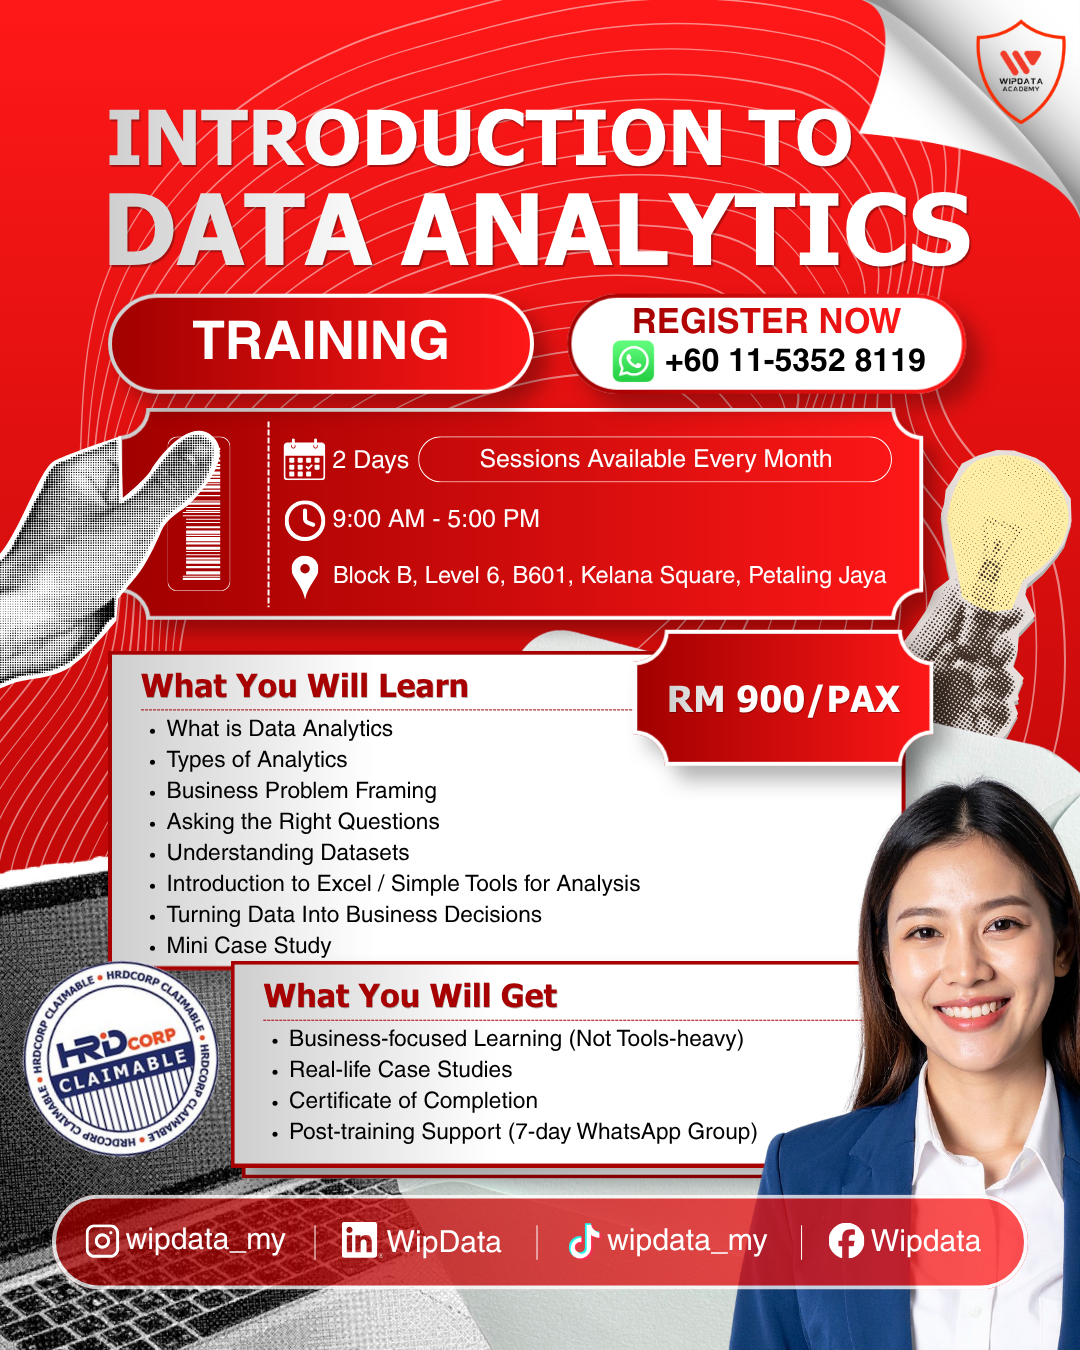
Introduction to Data Analytics
RM900.00
Description
Duration: 2 days
Course Overview:
Data is now the defining resource of the modern workplace. Organisations that understand how to collect it, question it, and act on it consistently outperform those that rely on intuition alone. Yet for many professionals, data analytics still feels like a technical discipline that belongs to specialists with coding skills and advanced software. The truth is that the most valuable analytics skills are not technical at all. They are the ability to frame the right business problem, ask the right questions, understand what a dataset is saying, and communicate findings in a way that drives clear, confident decisions.
This two-day introductory programme is designed for professionals who want to develop a strong conceptual and practical foundation in data analytics without needing to become technical experts. Across eight modules, participants will explore what data analytics is and why it matters, the four types of analytics and when to use each one, how to frame a business problem clearly, how to ask precise analytical questions, how to read and understand a dataset, how to use Excel and accessible tools for basic analysis, how to translate data into actionable business decisions, and how to apply all of this in a structured mini case study exercise. The programme is business-focused by design, keeping tools in a supporting role and analytical thinking at the centre.
By the end of this programme, participants will be empowered to approach any business challenge with a data-informed mindset. They will know how to frame a problem before looking at data, identify the right questions to ask, work with a dataset confidently, perform basic analysis using Excel, and present findings in a clear and decision-focused way. The programme closes with a mini case study that puts all eight modules to work in a realistic, team-based scenario, giving participants first-hand experience of what a real analytics workflow looks and feels like from start to finish.
Audience:
Working professionals across all industries, functions, and seniority levels who wish to develop a practical understanding of data analytics without a technical background. Suitable for executives, managers, team leads, and individual contributors in functions such as HR, Finance, Operations, Sales, Marketing, and Administration who work with data as part of their role
Prerequisite:
No prior data analytics or technical experience required. Basic computer literacy and familiarity with Microsoft Excel (open, navigate, and enter data) is helpful but not essential. Participants should attend with an open, curious mindset and are encouraged to bring a real business challenge from their own role for use in exercises
Methodology:
The programme will maximise understanding and learning through Interactive Discussions, Business Focused Case Studies, Practical Exercises, Group Workshops, Real Life Scenario Analysis, and a Mini Case Study Project.
What will you get:
- Business-Focused Learning (Not Tool Heavy)
- Problem Framing Canvas Template
- Certificate of Completion
- Analytics Question Framework Reference Card
- Real-life case studies and Business Scenarios
- Mini Case Study Dataset and Working Files
- 7-Day Post-Training WhatsApp Support Group
- Wipdata Academy Learning Pathway Guide
Objective:
- Develop a clear understanding of what data analytics is, why it matters in the modern workplace, and how the four types of analytics (descriptive, diagnostic, predictive, and prescriptive) apply to real business situations.
- Apply business problem framing techniques and analytical questioning frameworks to define clear, measurable questions from ambiguous business challenges.
- Read, interpret, and assess the quality of a dataset, and use Excel and accessible tools to perform basic analysis and summarise findings for a business audience.
- Translate analytical findings into clear, decision-focused business insights and apply all programme skills end to end through a structured mini case study exercise.
Course Module:
Module 1: What is Data Analytics
- Defining data analytics in plain, practical language
- The difference between data, information, and insight
- Why organisations that use data well outperform those that do not
- The anatomy of a data-driven organisation
- Real-life examples of analytics at work across industries
- The analytics value chain: from raw data to business action
- Who does data analytics at work? The roles and responsibilities
- Where analytics fits into your current role, even without a formal title
Module 2: Types of Analytics
- The four types of analytics explained simply
- Descriptive analytics: what happened? Understanding the past through data
- Diagnostic analytics: why did it happen? Finding root causes in the numbers
- Predictive analytics: what is likely to happen? Using patterns to forecast
- Prescriptive analytics: what should we do? Using data to choose the best action
- Matching the right type of analytics to the right business question
- Real-life examples of all four types across sales, operations, HR, and finance
- Where most organisations are today and where the opportunity lies
Module 3: Business Problem Framing
- Why most analytics projects fail before they begin: unclear problem statements
- The difference between a symptom and a root cause
- How to write a clear, focused business problem statement
- The Problem Framing Canvas: objective, stakeholders, scope, and constraints
- Translating a business complaint into an analytical question
- Identifying what a good answer looks like before you start analysing
- Common business problem framing mistakes and how to avoid them
- Stakeholder alignment: getting everyone to agree on the real question
Module 4: Asking the Right Questions
- Why the quality of your question determines the quality of your insight
- The analytics question hierarchy: from vague to precise
- SMART analytical questions: Specific, Measurable, Achievable, Relevant, Time-bound
- Decomposing a big business question into smaller, answerable sub-questions
- Hypothesis thinking: forming educated guesses before looking at the data
- Identifying the right metrics to measure against each question
- Avoiding confirmation bias: how to question the data, not just confirm what you believe
- Practical question frameworks used by analysts across industries
Module 5: Understanding Datasets
- What is a dataset? Structure, rows, columns, and records explained
- Types of data: quantitative vs qualitative, structured vs unstructured
- Common data sources in organisations: ERP systems, CRM, spreadsheets, surveys
- Understanding data quality: accuracy, completeness, consistency, and timeliness
- Reading and interpreting a dataset for the first time: a practical approach
- Common data problems: missing values, duplicates, outliers, and inconsistencies
- Data documentation: what metadata is and why it matters
- How to profile a dataset before you start analysing it
Module 6: Introduction to Excel and Simple Tools for Analysis
- Why Excel remains the most accessible and widely used analytics starting point
- Organising data correctly in Excel: tables, headers, and consistent formatting
- Sorting and filtering: finding what matters in a large dataset quickly
- Basic formulas for analysis: SUM, AVERAGE, COUNT, COUNTA, MAX, MIN
- Conditional aggregation: SUMIF and COUNTIF for business calculations
- Pivot Tables for non-technical users: summarising data in minutes without formulas
- Simple charts: choosing the right visual for the data story you want to tell
- Conditional formatting: turning numbers into instant visual signals
- Introduction to other accessible tools: Google Sheets, Power BI overview, Canva for data visuals
Module 7: Turning Data Into Business Decisions
- The gap between analysis and action: why data alone does not drive decisions
- What makes an insight actionable: specificity, relevance, and timeliness
- Structuring findings for a non-technical audience
- The Pyramid Principle: leading with the conclusion, supporting with data
- Translating numbers into business language your stakeholders understand
- Common mistakes when presenting data to management
- Building a simple findings summary: what happened, why it matters, what to do
- Data ethics and responsible analytics: accuracy, fairness, and context




Reviews
There are no reviews yet.